
Executive Summary
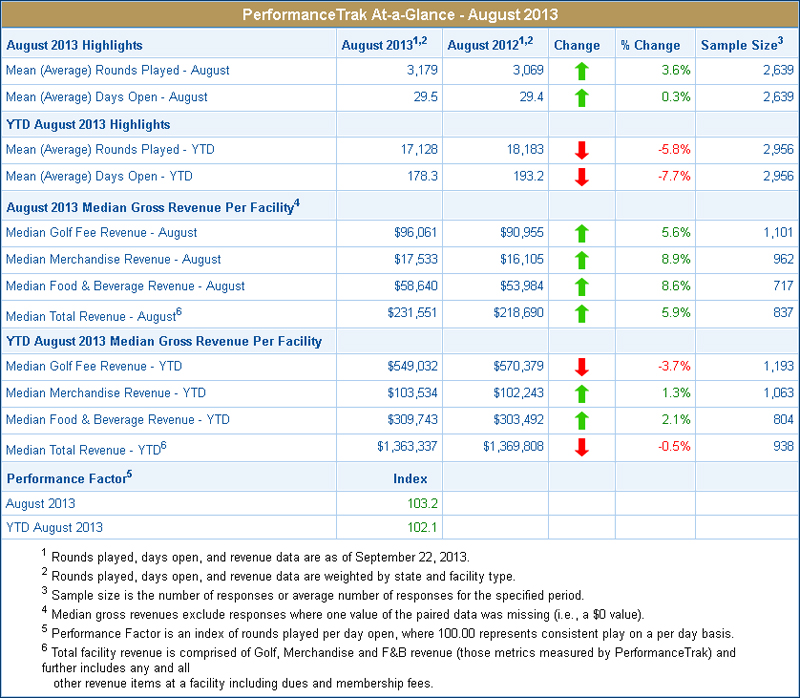
August 2013 rounds were up 3.6% and days open were up slightly 0.3% compared to August 2012, based on paired data.
August results are based on useable responses from 2,639 facilities. The slight days open increase supports a portion
of the rounds played increase. Another contributor, August 2013 had one more weekend day (9) than August 2012 (8).
Approximately 71% of the annual rounds played have been played through August. For each facility type, please see the
year-to-date rounds played comparison for a break down on page four.
Through the first eight months of 2013, the days open for play were the lowest in the history of PerformanceTrak. YTD
2013, there were approximately 15 fewer days open than YTD 2012. It remains clear the below-average weather at the
start of the typical golf season had an impact on year-to-date performance. The average rounds played YTD are the
second lowest compared to all other YTD August figures. Despite the impact of weather, YTD rounds played per day open
were at an eight year high. See Performance Factor in the chart below.
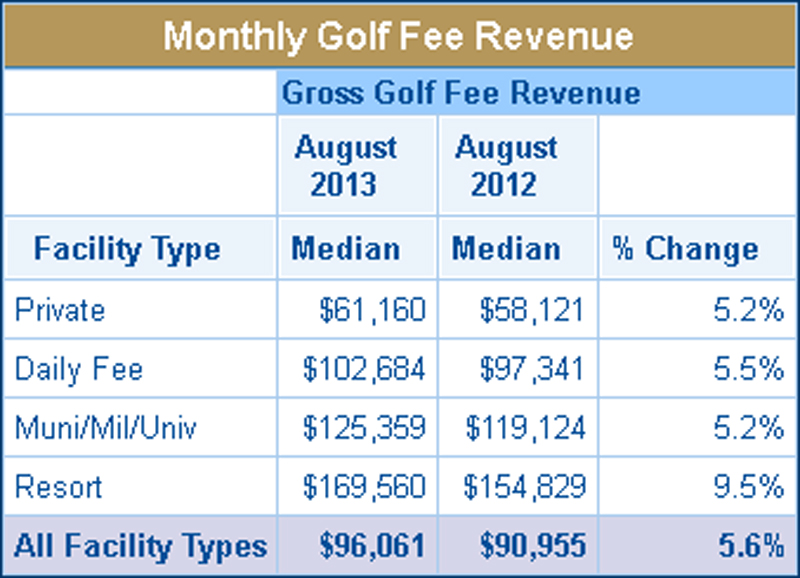
Each of the four key revenue figures for the month were up. Median merchandise revenue for August 2013 had the
largest increase at 8.9% followed by increases in food and beverage revenue at 8.6%, total facility revenue at 5.9% and
golf fee revenue at 5.6%.
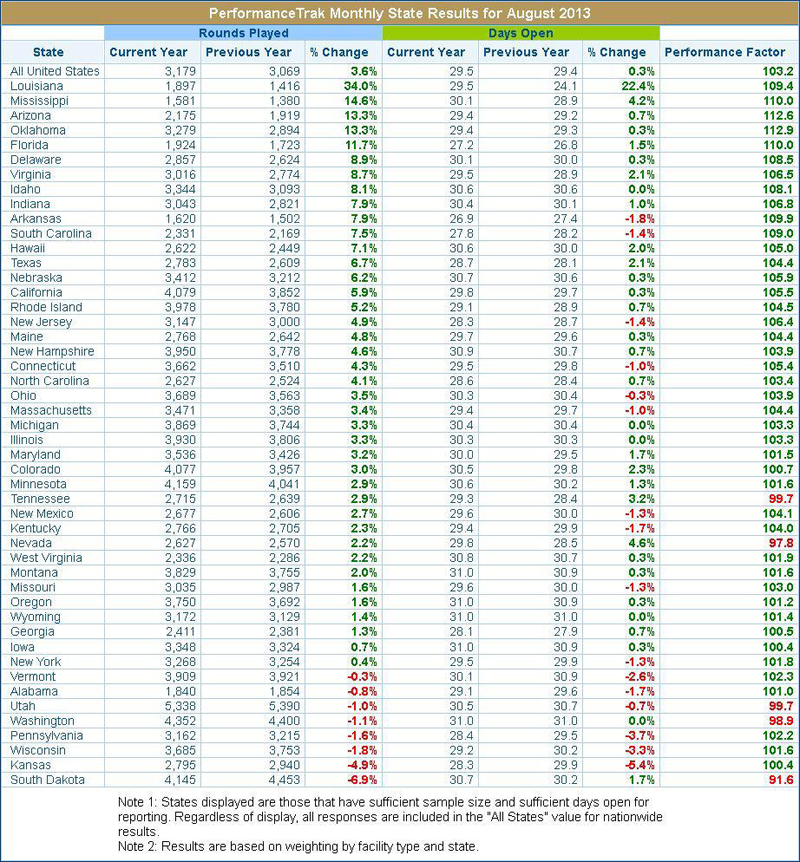
August State-by-State Performance
State-by-state results are below for monthly rounds played and monthly days open. Also reported is the
Performance Factor which takes into account the change in rounds played per day open. 40 states had increases in
rounds played. 16 of these states had either decreases or were near flat in days open. Currently, based on the
Performance Factor, the top 5 states are Oklahoma, Arizona, Mississippi, Florida and Arkansas. There were a total
of 43 states with a Performance Factor of 100 or higher. On the local market level, the top three with August rounds
played increases were: New Orleans (LA), Vero Beach (FL) and Ocala (FL).
August Weather Summary
Cooler temperatures than usual for August set up favorable conditions for play from the East Coast to the Midwest. There
were rounds played increases for sixteen of the nineteen states reporting much cooler temperatures. Kansas had cooler
conditions reported yet much-above average precipitation in August likely leading to their decreases in rounds played
(down 4.9%). However, there were six states that increased their August play under cooler/wetter conditions (AR, SC,
MD, KY, WV, and GA) versus last year. There were also states with much warmer conditions this August. Three
warmer/drier states fared well in these circumstances (Texas, Minnesota and Wyoming). Four of six states with much
warmer/wetter rankings resulted in rounds played increases (MT, OR, AZ, FL). The two with decreases in rounds were
South Dakota (down 6.9%) and Washington (down 1.1%). While localized weather affects golf facilities where they are
specifically, the macro level weather trend for 2013 is significant across the country.
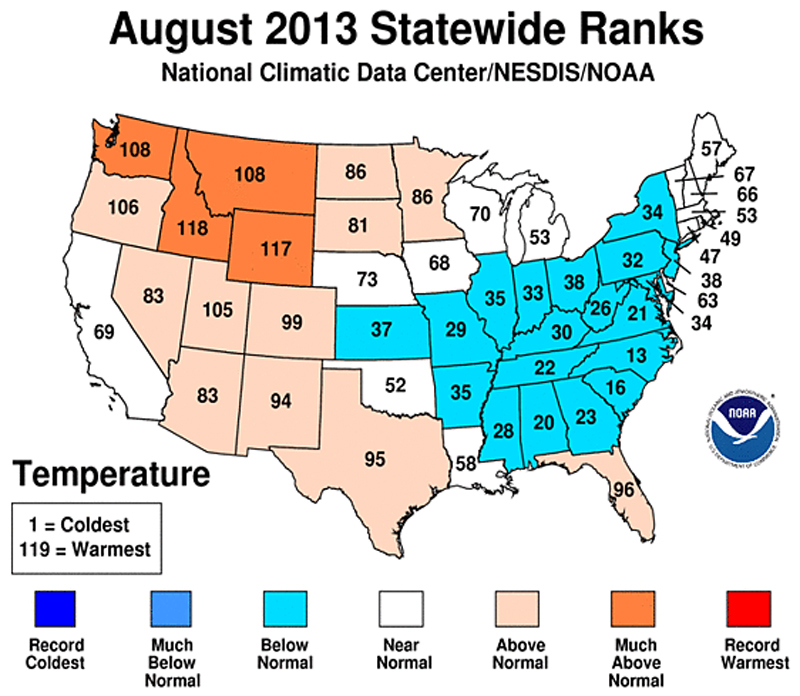
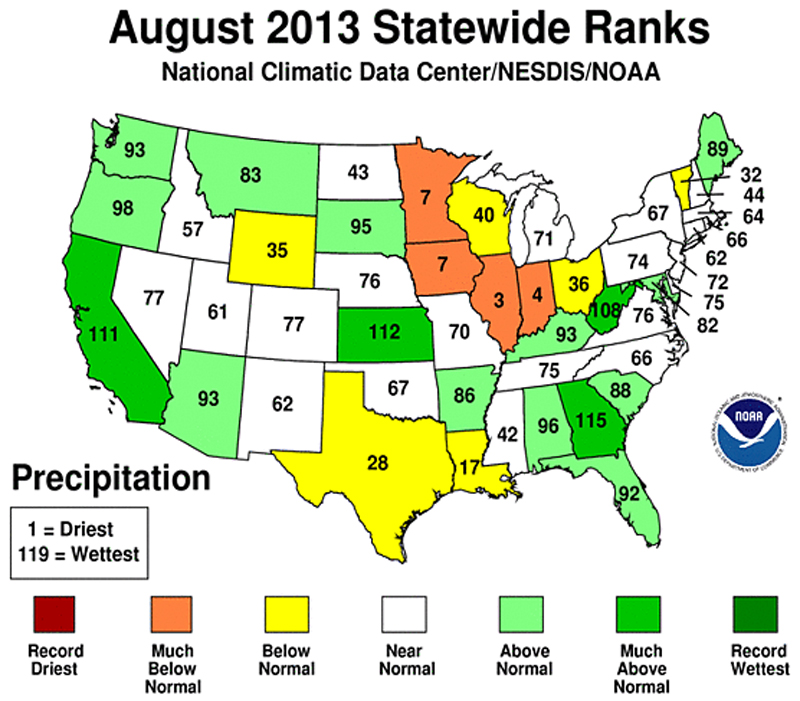
For the maps above: The numeric value within an area represents where it falls within the rank from 1 to 119 which covers the historical period
of record-keeping (119 years). It is sorted from highest to lowest value (Coldest/Driest to Warmest/Wettest). For example, if the value equals
18 on the 1 to 119 scale, it represents the 18th coldest / driest period on record. A value of 117 would represent the 3rd warmest / wettest. August Revenue Summary by Facility Type
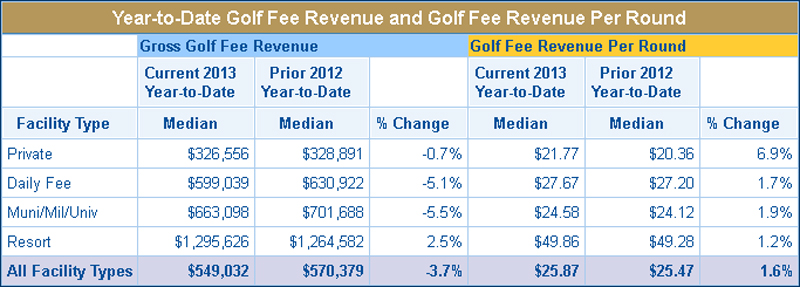
This summary is from the data set of rounds and golf fee revenue responses where facilities provided both data
points (both rounds played and golf fee revenue). Therefore, the sample here for rounds played is different than the
overall rounds sample from results presented in prior pages within the newsletter. We continue to see slight YTD
increases in the revenue per round played (actual rate) for all facility types despite revenue being down. The
revenue per round played increases for each facility type are typically due to declines in rounds played volume
compared to last year and does not necessarily mean there has been revenue/rate growth.
Please note: Golf Fee Revenue includes green fees, guest fees, trail fees, cart fees and any pro-rata portion of golf
pass/pre-paid greens fees for the period.
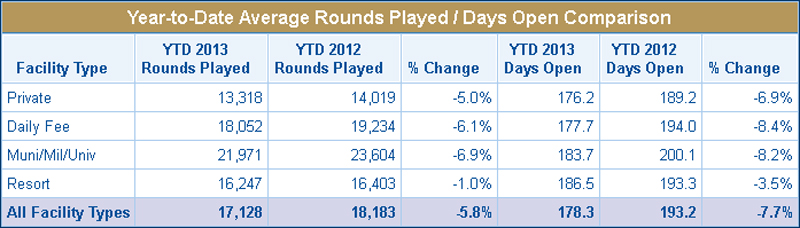
YTD Rounds Played by Facility Type
The PerformanceTrak rounds played comparison report for August 2013 YTD is below with statistics by facility type
including average rounds played, same month year-to-year comparison, days open, and days open change. Note,
the YTD August 2013 days open decline was against a YTD August 2012 days open increase of 9.3%.
YTD Rounds Played Percent Change by State Maps
This map provides YTD August 2013 rounds played results compared to YTD August 2012 with a percent
change range. There were eight states with YTD rounds played increases: Washington (5.7%), Oregon (5.2%),
Maine (3.1%), Hawaii (2.1%), Idaho (2.1%) and Montana (0.9%). Texas and Florida were up slightly, 0.5% and 0.1%
respectively. Currently, based on the YTD Performance Factor, the top 5 states are Vermont, Minnesota, Maine,
Rhode Island and Iowa.
A total of 39 states were affected YTD by above average precipitation which assists rounds played and days open
declines. However, 27 of these states had a positive Performance Factor, meaning their play based on weather/days
open was consistent or up compared to the same period last year. Additionally, four states were warmer than normal
year-to-date (PA, WA, AZ and GA). Washington is the only state of these four with an increase in YTD rounds.
Georgia was record wet the first eight months of the year, down in rounds 8.5% and down in days open 3.9%. On
the west coast, California remains record dry this year (down 1.0%). Each state with YTD rounds played decreases
above 10%, experienced precipitation levels much above normal with the exception of Pennsylvania.
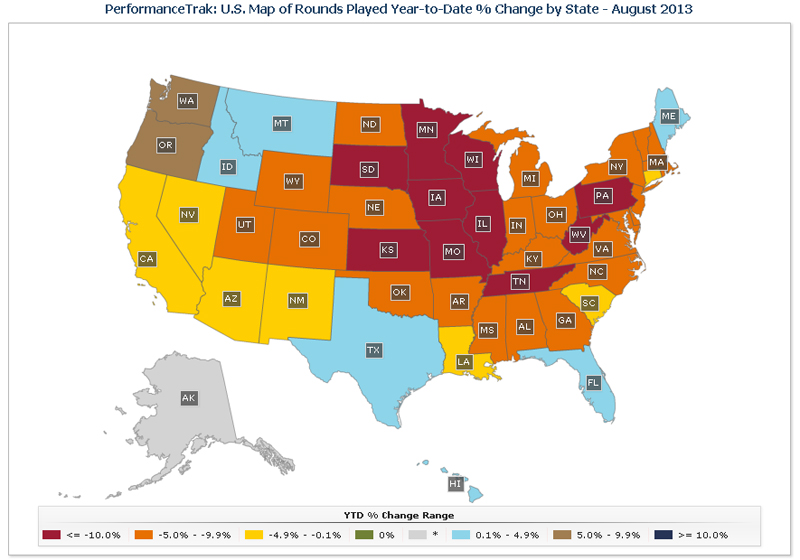
For this map the * symbol (grey area) indicates insufficient number of responses in order to display accurate data.
YTD Gross Golf Fee Revenue Percent Change by State
This map provides YTD August 2013 gross golf fee revenue results compared to YTD August 2012 with a
percent change range. Washington and Oregon remain the only states with a golf fee revenue increase over 5%.
Other gross golf fee revenue increases occurred in Idaho (up 4.7%), Nevada (up 2.5%), Utah (up 1.3%) and
California (up 1.3%). New Mexico reported a small YTD golf fee revenue increase of 0.3% compared to last year. In
total, fifteen states saw improvements in their YTD gross golf fee revenue percent changes compared to last
month’s. These values are based on a sufficient average monthly sample size for the year for the local market, state
or PGA Section. Golf Fee Revenue includes green fees, guest fees, trail fees, cart fees and any pro-rata portion of
golf pass/pre-paid greens fees for the period.
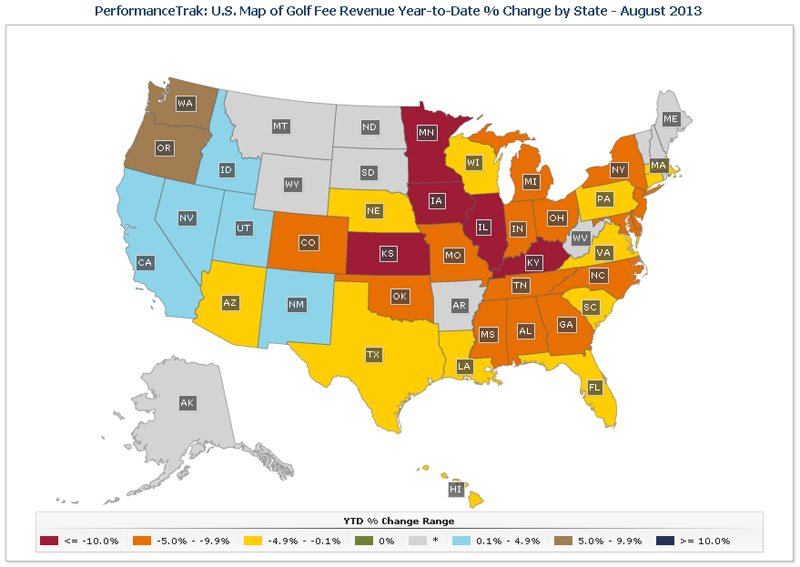
For this map the * symbol (grey area) indicates insufficient number of responses in order to display accurate data.
About PerformanceTrak
PGA PerformanceTrak in Cooperation with the NGCOA is the industry’s leading rounds and revenue data
collection and benchmarking service. Reports are available for PGA Sections, States and over 70 local markets.
NGCOA report packages are also available for some local competitive golf markets (CGMs) and for rate sets within
CGMs. Reports include data for each metric (e.g. median golf fee revenue), not just the percent change, for rounds
played and four Key Performance Indicators. A dedicated team at the PGA of America National Office gathers this
data monthly to support participation and benchmark reporting across the country and to assist with customer
service inquiries. PerformanceTrak has a high standard regarding data quality. Information submitted is reviewed for
significant changes and outliers, feedback is gathered from users regarding their specific operations and their local
area and any outlier of data is omitted from reporting. PerformanceTrak is a fully online, web-based service with
real-time reports available 24/7. Flexibility of data submission is offered to all users when a non-online approach is
needed.
Contact Us
PGA PerformanceTrak Services and Support
PerformanceTrak@pgahq.com
www.PGAPerformanceTrak.com
The PGA of America:
Nicole Ferguson-Sutherland
(800) 477-6465 Ext. 8574
NFerguson@pgahq.com
For Media Inquiries:
Randy Stutzman
(800) 477-6465 Ext. 8438
RStutzman@pgahq.com
NGCOA:
Joe Rice
(800) 933-4262 Ext. 222
JRice@ngcoa.org
www.NGCOA.org/benchmark www.PGAPerformanceTrak.com/NGCOA